Usage Analytics
Similar to how you are using the data from your database in order to generate insights on your end users, the Usage Analytics functionality will allow you to visualize insights on your internal users, via our:
- Usage Analytics dashboard, accessible in your account via the "Analytics" tab
- Usage Statistics dataset, accessible in your account and populated with data specific to your organization
The Usage Analytics dashboard
Allows you to narrow down the data on the basis of:
- the timeframe
- the role or user name of a specific user
- the name of the dashboard
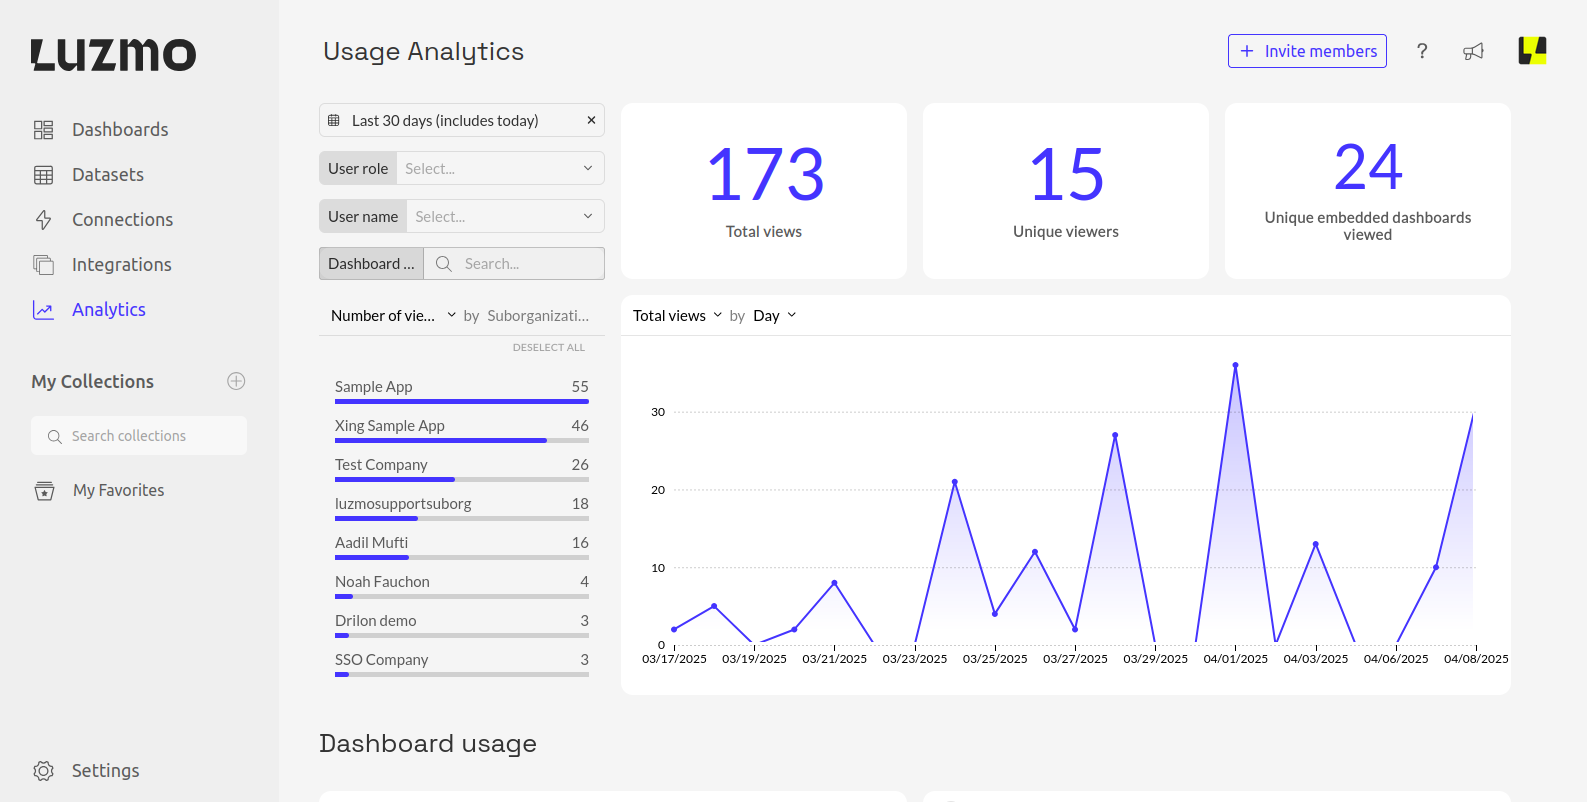
It also showcases:
- the top users with the most views
- the top dashboards with the most views
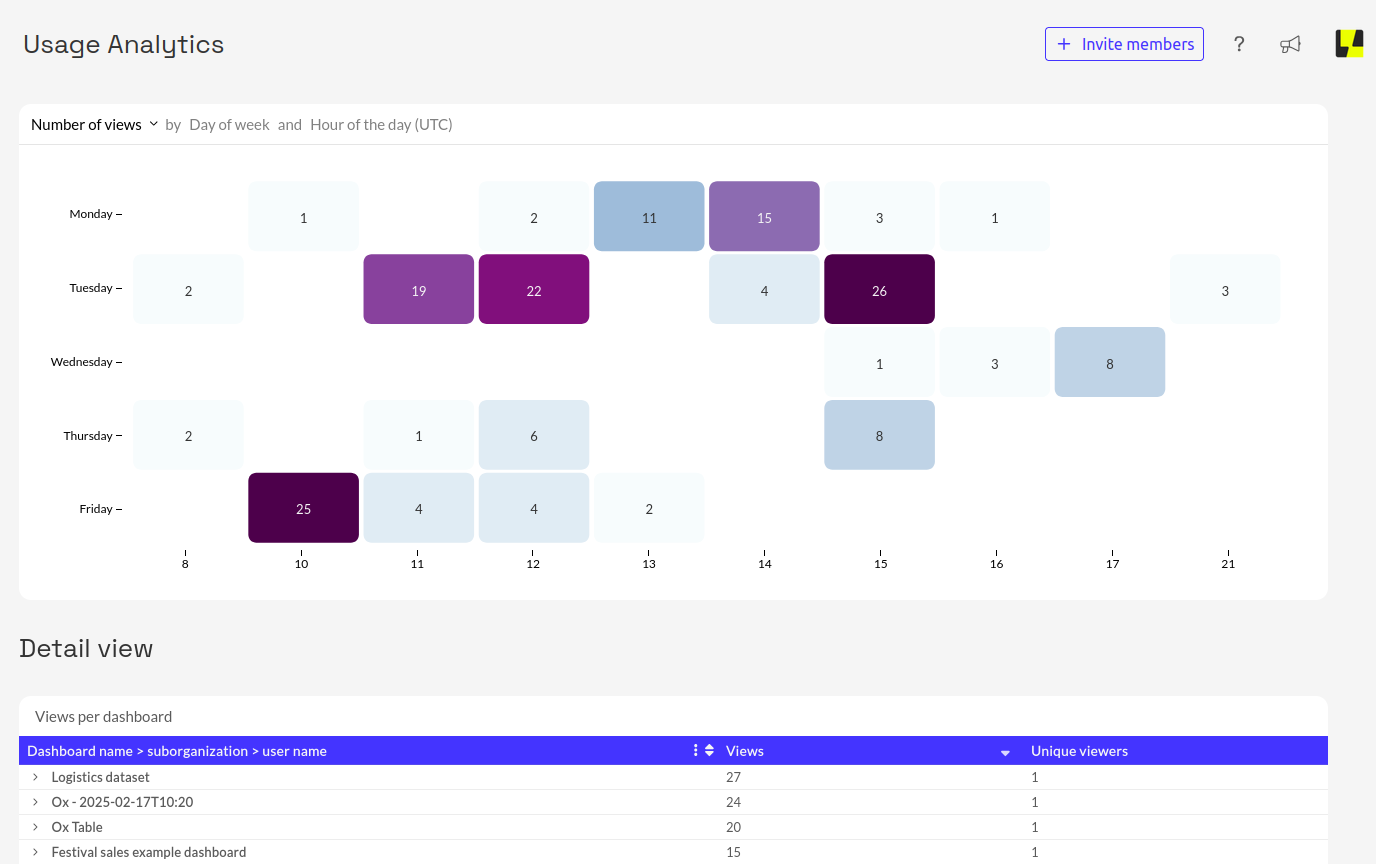
- the number of views of a specific dashboard filtered by the day and hour
- a detailed view of the dashboard views, expandable on the basis of suborganizations and user names
The Usage Statistics dataset
Contains information for our organization around:
- how often was a dashboard viewed (in a selected timeframe)
- what suborganization do the users belong to
- what is the defined role of the users who accessed the dashboard
The dataset can be found here or by searching for "Usage Statistics" while filtering for "Public" datasets. Note that although it appears as Public it will only have data specific to your organization.
Notes
- Usage Analytics is only available to organization owners on Pro, Elite, and Enterprise Plans. Pro users will have access to 1 month of data, while Elite users will have access to 1 year of data.
- Usage Analytics has information of usage by embedded users accessing your dashboards & data via embed tokens. Usage by embedded users accessing your dashboards & data with the deprecated token types of sso and temporary are not included.