Aggregation formulas
What are aggregation formulas?
Aggregation formulas allow you to create formulas that transform your data before it is displayed in charts or tables. They differ from derived columns in that the calculations can go beyond record-level data. This allows you to use aggregation functions like average or count that are dynamically calculated based on groupings and filters in your charts and tables.
Aggregations will be calculated based on dimensions and groupings in your charts or according to the grouping options you select in your formula.
Adding a new formula
Aggregation formulas are added on the dataset level. To create a new formula, go to the relevant dataset, click the "+ Add" button, and click "Formula".
The formula editor will open, where you can use your dataset's columns and various functions to transform your data. Functions listed in the "Aggregations" column transform your record-level data into aggregated data. Once you drag and drop an aggregation to the editor field, it will expand into a widget where you can:
- change the aggregation in the left-side dropdown
- drag & drop or type columns or expressions in the middle input field
- change the grouping option in the right-side dropdown
Once you are done defining your formula, confirm its creation by clicking "Save". Your formulas will appear on the right side the dataset editor.
Grouping options
Grouping options for aggregation formulas allow you to define over which dimensions an aggregation function should be calculated.
GROUPED
By default ("grouped"), aggregations are calculated based on the dimensions in a chart or table. For example, when a chart shows daily data per country, the aggregation functions will be calculated for each combination of day and country. When you need finer control over the groups used to calculate aggregations, you can use one of the other two grouping functions below.
FULL
Use the "full" grouping option to force the aggregation to be calculated over the full dataset after filters, ignoring any group or dimension present in the chart.
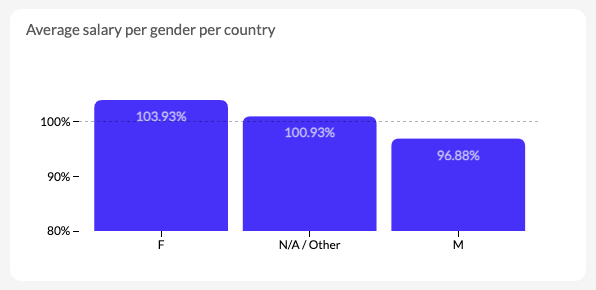
Example: A chart that shows average salary per gender as a percentage of company average
Assume a company dataset with employee information. This formula compares average salaries to the company average:

Consider a chart that categorizes by gender. This formula will calculate the numerator per gender and the denominator for the entire company dataset (ignoring the gender dimension).
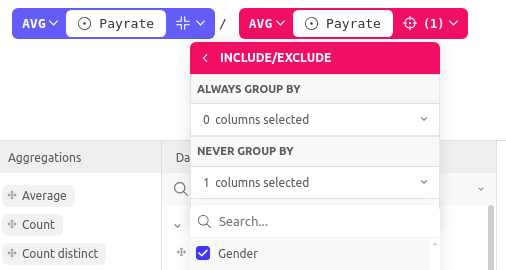
INCLUDE/EXCLUDE
Use the "include/exclude" grouping option to include and/or exclude specific columns as dimensions to group by. This will overwrite the groups / dimensions of a chart.
Nested Aggregation Formulas allow you to apply an aggregation on top of another aggregation. They are currently available in beta on supported native SQL pushdown connectors. To request access, please reach out to Luzmo Support or your dedicated Customer Success Manager.
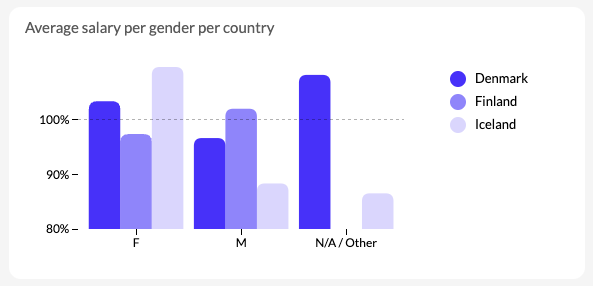
Example: A chart that shows average salary per gender as a percentage of country average
Assume a company dataset with employee information. Compared to the previous example, you want to compare salaries to their country average, instead of the full dataset's company average. This can be done with the following formula, selecting the "Gender" column in the exclude list:
Consider a chart that categorizes by gender and groups by country. The denominator of this formula will be calculated for each gender and country combination. The denominator will be calculated for each country, excluding genders as a separate group.
Notice that you could use the same formula to analyze gender over other groupings than country, such as role, team, etc.. The formula will automatically adapt, with the only exception that the denominator will always exclude Gender as a dimension to group by.
Examples
1. Create a rate calculation with non-numeric values
Assume you run a sneaker store chain, and you want to calculate the number of orders per store. This formula gives you the number of orders per store:
COUNTD(Order ID) / COUNTD(Store ID)
You can use this formula in any measure slot. A powerful characteristic of calculating rates with formulas is the ability to group the results over a different dimension. For example, this chart shows the total orders per store over time, grouped by order channel (offline or online):
2. Combine different aggregation functions
Assume you want to track overall employee efficiency, for example, to track how many issues your support team handles or how many deliveries your drivers are fulfilling. You could do that with the following formula:
SUM(Completed tasks) / COUNTD(employees)
Here are a few other common examples for inspiration:
- Average Deal Size:
SUM(Contract size) / COUNTD(Deals) - Biggest and Smallest Order Size:
MAX(order_size) - MIN(order_size) - Inventory Turnover:
SUM(Units Sold * Units Price) / AVG(Inventory) - Average Stay Duration:
SUM(Stay duration) / COUNTD(Booking ID) - Utilization Rate:
SUM(Operating hours) / (Count(Machines) * SUM(Available hours)) - Max Response Time vs Average:
MAX(Response time) / AVG(Response time) - Average Customer Lifetime Value:
(AVERAGE([Purchase Value]) * AVERAGE([Purchase Frequency]) * AVERAGE([Customer Lifespan]))
3. Combining aggregations with other formula functions
Net Promoter Score (NPS):
Combine COUNT functions with IF statements to calculate an NPS score from individual NPS surveys.
NPS is generally calculated as (promoters - detractors) / respondents, where promoters are all respondents with a score above 8, and detractors are all respondents below 7. For a dataset where each record holds a score from a respondent, the formula would be:
(COUNT(IF(Score > 8, 1, null)) - COUNT(IF(Score < 7, 1, null)))*100 / COUNTR()
4. Use a nested aggregation formula
Assume you want to calculate the average of revenue totals per store, instead of a single revenue total across all rows. This can be done with the following formula:
AVG(GROUPINEX(SUM(Revenue), [Store], []))
This formula first calculates SUM(Revenue) per store, and then applies AVG() on top of those store-level totals. When using Nested Aggregation Formulas, the inner aggregation must be calculated at a finer granularity than the outer aggregation.
Nested Aggregation Formulas are currently available in beta on supported native SQL pushdown connectors. To request access, please reach out to Luzmo Support or your dedicated Customer Success Manager.
Ad-Hoc formulas in Flex
Ad-hoc Formulas provide an efficient way to create and manage aggregation formulas directly within your code, bypassing the need to use our UI for formula creation. This feature offers greater flexibility by allowing you to write formulas directly into Luzmo Flex components, using the same formula property that previously only accepted formula IDs.
Now, instead of creating a formula in our UI and referencing it by ID, you can write the formula itself directly in Flex. If useful, you can first validate the ad-hoc formulas via API (documentation), or even use our "IQ Formula" API to generate Formulas from natural language!
How to Use Ad-Hoc formulas
You can now input aggregation formulas directly within the Flex formula property. The formula property supports:
- Formula IDs (created through our UI).
- Ad-hoc formulas written directly into the Flex code for more flexibility.
When you write the formula directly, it functions exactly as if you had created it in our UI, allowing you to use aggregation functions (like SUM, COUNT, AVG, etc.) and transform your data based on groupings and filters in your charts or tables.
Example
Here is an example that can be used in the Flex slots property.
Formula: Inventory Turnover: SUM(Units Sold * Units Price) / AVG(Inventory)
In Flex:
"formula": "SUM({d0ae9e10-f459-4fe4-84cd-6e26193c2644:47f3e4b0-20dc-4e44-b3c3-ddf4c8807caf}*{d0ae9e10-f459-4fe4-84cd-6e26193c2644:df7005c0-a8bd-4ef5-a464-46de160fb3b0})/ AVG({d0ae9e10-f459-4fe4-84cd-6e26193c2644:0804bdb1-538c-4c37-9acb-e59676a0bef6})"
The "Full" grouping option can be used with the following syntax: GROUPFULL( aggregation function ).
The "include/exclude" grouping option can be used with the following syntax: GROUPINEX( aggregation function, [ columns to group by ], [ columns to exclude from grouping ]). Multiple columns can be included in the array, separated by commas.
The structure requires to use {datasetID:columnID} to reference the column in your dataset.
Limitations
The current version of aggregation formulas has a couple of limitations. Keep these in mind when you're creating your formulas. We plan to remove these limitations in future updates.
- Formulas always need to result in aggregated data. Example:
Column B - AVG(Column A)is invalid, because it would results in record-level data. If you want to produce record-level data, use derived columns instead. - Formulas always need to result in numeric data. Example:
if(max(Column)>50, 1, 0)is a valid formula, butif(max(Column)>50, 'threshold reached', 'within threshold')is not. - Nested Aggregation Formulas are currently available in beta on supported native SQL pushdown connectors. When nesting aggregations, the inner aggregation must be calculated at a finer granularity than the outer aggregation. For example,
AVG(GROUPINEX(SUM(Revenue), [Store], []))is valid because it first calculates revenue per store and then averages those store-level totals. Some limitations still apply in beta, including unsupported cases such as HAVING, window aggregations, powerset dimensions, and non-pushable joins . To request access, please reach out to Luzmo Support via support@luzmo.com or your dedicated Customer Success Manager. - Formulas can only be used in "Measure" slots of charts and tables.