Designing for Clarity: Layout and Structure Best Practices
This article focuses on effective layout and structural design principles, such as optimizing screen space, minimizing clutter, and arranging data elements logically. Implementing these best practices will ensure that your dashboards not only look good but also function effectively, providing valuable insights with minimal effort.
Logical Placement of Elements:
The placement of visual elements on a dashboard can significantly impact its usability. As shown in the example below key components such as charts, filters, and primary metrics should be positioned in a way that aligns with user expectations and enhances accessibility. For example:
- Logical Flow: Dashboards are typically read from left-to-right and top-to-bottom. Position the most important information in the top-left corner, followed by charts and elements that support the main message. This ensures that users encounter the most critical data first.
- Filters: Place filters at the top of the dashboard if they apply to all charts, or position them specifically above or within sections where they interact with related charts. This setup ensures users can easily find and use filters to refine their data.
- Primary Metrics in Charts: Highlight key metrics prominently using size, color, or positioning to draw user attention. Ensure that these metrics are easily visible and stand out from less critical data.
- Detailed Information: If detailed, row-by-row information is necessary, place it in a table at the bottom of the dashboard. This approach allows users to first interact with high-level visual data and then refer to the table for more granular details if needed.
- Topic-Based Organization: Organize the dashboard into sections or tabs based on specific topics or functions. This prevents information overload and helps users focus on relevant data. Group related charts together to provide a cohesive view of related KPIs.
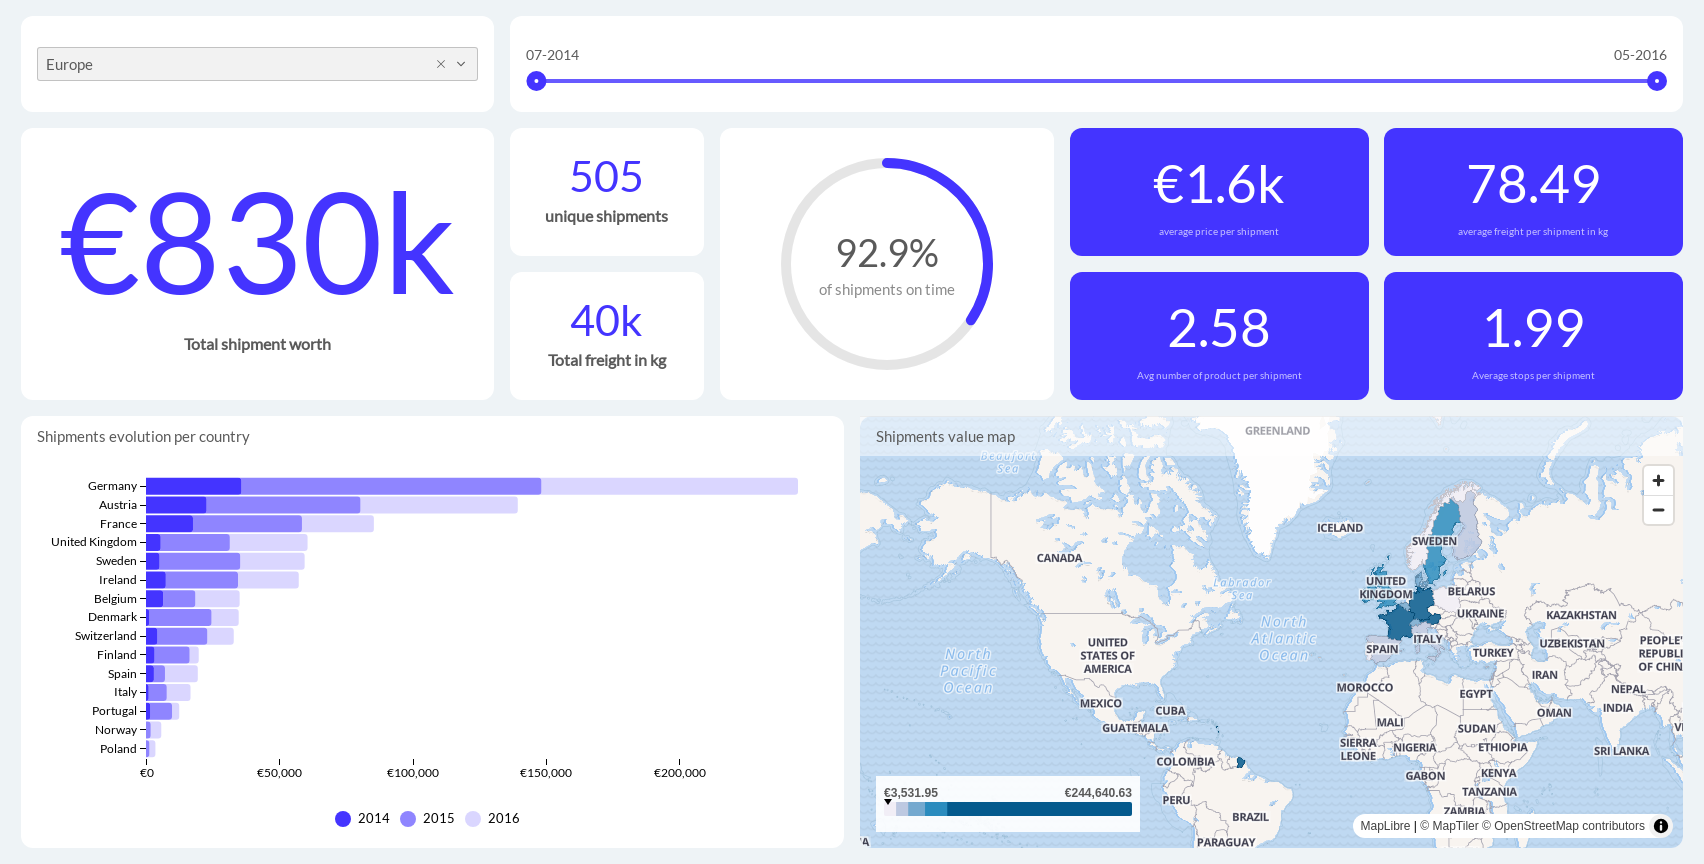
Single Screen:
One of the fundamental principles of effective dashboard design, as seen in the example above, is ensuring that users can view all critical information within a single screen. This “above the fold” approach enables users to quickly grasp key data points without the need for excessive scrolling or navigation. Here’s how to achieve an optimal single-screen experience:
- Screen Mode Adaptation: Ensure that the dashboard layout is appropriately formatted for different screen modes and device types. For example, items might be placed side-by-side for desktop viewing, but vertically for mobile. For detailed guidance on setting up your dashboard for various screen modes, refer to this Academy article .
- Avoid Excessive Scrolling: If you find the need to show more data, it may indicate that the dashboard is trying to convey multiple messages. In such cases, consider splitting the dashboard into multiple views, each focusing on a core subject.
- Maximize Screen Width: Utilize the full width of the dashboard to avoid unnecessary whitespace. This ensures that all visualizations are presented effectively and that the screen space is used efficiently.
Data-to-Ink Ratio:
The concept of data-to-ink ratio, emphasizes the importance of minimizing non-data ink in a visual presentation. In other words, every element on a dashboard should serve a purpose and contribute to the overall understanding of the data. Avoid unnecessary embellishments or decorative elements that do not add value. Instead, focus on clear, concise visuals that directly communicate the information. For example:
- Number with excessive decimal places.
For example, “$1.6B” is much easier to process for the human brain than “$1 648 745 659.51”.
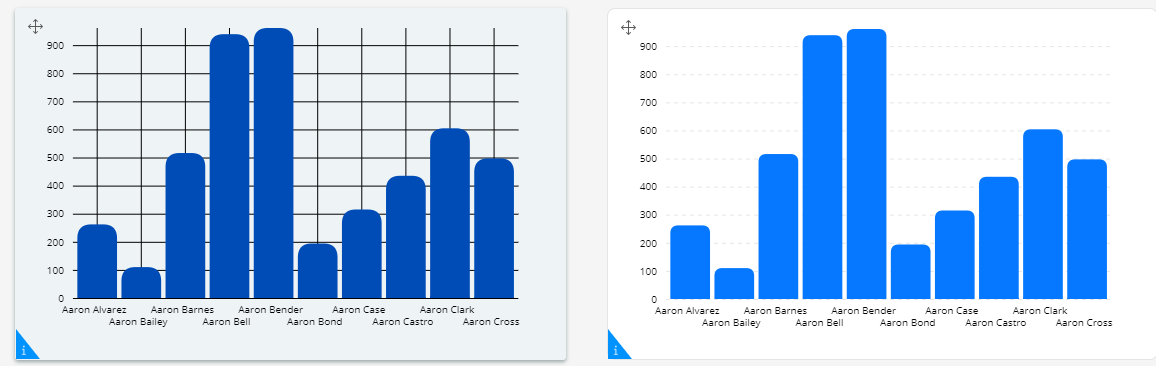
- Overcomplicated charts filled with unnecessary borders, shading, and detailed subcategories can overwhelm users. Simplify the chart by removing extraneous borders and focusing on essential data points, using clean lines and clear headers to improve readability.
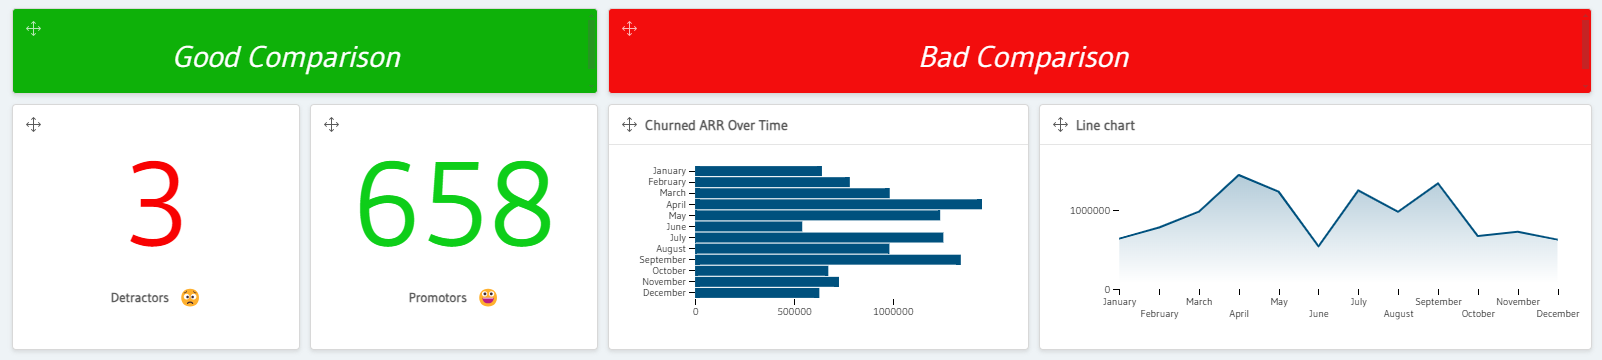
Effective Data Comparison:
When comparing data, ensure that related datasets are visually aligned to facilitate easy comparison. Use consistent scales and formats, and avoid overly complex or misleading visualizations. Clear labeling and intuitive arrangement of data points will help users quickly discern differences and trends. If you are displaying comparison in two charts then try to place them beside each other and use the same chart type, like in the first example below.