Performance tips
Your embedded reporting or analytics environment is an integral part of your SaaS app or platform, and users expect the same great performance as the rest of your application. This can be challenging as queries tend to involve your full historical dataset.
1. Limit the number of charts in a single dashboard
Each chart fires off one (or, in rare cases, two) queries. Showing the most pertinent data only also helps your clients focus on what's important.
What do do:
- Limit your dashboard to a single page length. This is also a data visualization best practice (whitepaper).
- Use 'Custom events' / 'Go-to-URL interactivity' to link multiple dashboards, eg. overall + detail.
2. Enable query caching
For datasets backed by databases or Luzmo Plugins, you can enable query caching in Luzmo. This means query results will be kept for a set period of time, during which identical queries will be served from the cache. Caching is available at two levels:
- On individual datasets: you can set this via the Dataset detail page (see below), or via the Securable API entity
- On database connections or Plugin connection: via the Account API entity

3. Analyze query performance and tune indexes
Using our query logs functionality, you can identify queries that run long. Once you have identified them, you can now analyze why they take long to complete in your database.
What to do:
Analyze your queries by running EXPLAIN or EXPLAIN ANALYZE.
Background:
Database systems like PostgreSQL, MySQL or SQL Server can log slow queries, submitted queries taking longer than X seconds to complete.
You can then easily analyze why these queries are running slowly by executing the following queries:
EXPLAIN <...> or
EXPLAIN SELECT <...> (PostgreSQL only)
This will show the 'query plan' your database calculates for this query:

We see PostgreSQL has to do a full scan through the entire table (Seq Scan), contributing almost 100% of the full expected cost of this query.

Adding a non-clustering secondary index on this table reduces the expected cost by 50%, at the cost of increased storage of the index itself and slightly slower INSERT & UPDATE queries, as the index has to be kept up-to-date.
Especially for big tables and columns that are very often used as filters (eg. 'customer_id', 'date', ...), adding a few strategic indexes can improve the performance tremendously.
4. Materialize views
If you use complex views joining data from a large number of other tables, or aggregate data, you might not want to perform that calculation on every query. Instead, you can store the results of the query and use that as a data source. This is called 'materialization' or 'memoization'.
In PostgreSQL, you can create a materialized view:
CREATE MATERIALIZED VIEW materialized_view_<123> AS
SELECT * FROM view_<123>
To refresh the information, you periodically run:
REFRESH MATERIALIZED VIEW materialized_view_<123>
MySQL/MariaDB currently doesn't have native materialized views, but you can emulate it by creating tables and triggering a refresh of the data through scheduled events:
TRUNCATE TABLE materialized_table_<123>;
INSERT INTO materialized_table_<123>
  SELECT * FROM view_<123>;

DELIMITER |

CREATE EVENT update_materialized_table_<123>
  ON SCHEDULE EVERY 1 DAY
    STARTS CURRENT_TIMESTAMP
  DO
    BEGIN
      TRUNCATE TABLE materialized_table_<123>;
      INSERT INTO materialized_table_<123>
        SELECT * FROM view_<123>;
    END |

DELIMITER ;
5. Avoid using derived columns as metrics
What to do:
- Move the calculation to your source table/dataset, eg. by creating a view:
CREATE VIEW view_<table> AS
SELECT
	*
	, IF(column = 'A', 'B', 'C') as my_derived_column
FROM
	<table>
- Using derived columns as dimension is generally fine.
Background:
Luzmo tries to maximally involve your connected database or plugin in queries by executing as much of the query as possible on your database ('pushdown'), as close to where the data is actually residing (locality principle).
For example, WHERE filters, GROUP BY operators or aggregations like SUM(), COUNT() are generally executed on your database.
This is not possible for derived column metrics, because of subtle differences in the semantics of eg. how NULL values are handled between different database systems.
6. Avoid high-granularity links in Luzmo
What to do:
- Use links in Luzmo for combining data across different data sources or for unbalanced datasets(link a big table with a small table), eg. reference or translation datasets.
- Links at a very fine granularity (eg. transaction / sensor data point) are better executed within a view in your database or plugin.
Background:
When you define a link in Luzmo between 2 datasets SensorA (EventID) <-> SensorB (EventID), and then query:
Aggregate:
- AVERAGE(SensorB.Value)
Group by:
- SensorA.Month

  Returns 10 rows (one per month)
The following queries will be executed:
SELECT EventID, Month FROM SensorA GROUP BY EventID, Month
  Returns 17 343 323 rows (one per event)
SELECT EventID, AVERAGE(SensorB.Value) FROM SensorB GROUP BY EventID
  Returns 17 343 323 rows (one per event)
Note that even though we can push down aggregations and the final result is small, each unique EventID, and in this case thus, each row has to be retrieved to join the 2 tables.
If SensorA and SensorB are in a single data source, we could define a view:
CREATE VIEW Sensor AS
SELECT * FROM SensorA
   JOIN SensorB
     ON SensorA.EventID = SensorB.EventID
Luzmo can now fully push down the query and only the 10-row long result will be transferred.
7. Pre-filter your dashboard
When designing dashboards for collections, pre-filter your dashboard using dashboard filters and parameterizable filters to show only data for a single end-client. This filter will be 'pushed down' towards your database or Plugins.
8. Use a read-replica
If you're using your application database as data source and have a write-heavy load from your main application (INSERTs and UPDATEs), you might start seeing slowdowns as the analytical queries from Luzmo or other analysis tools use up a lot of disk I/O, memory and CPU causing resource contention for your 'regular' queries.
At that stage, you might want to add an additional read-replica reserved for analytical queries:
- Your master node handles writes & reads from your application.
- A read-replica handles reads from Luzmo.
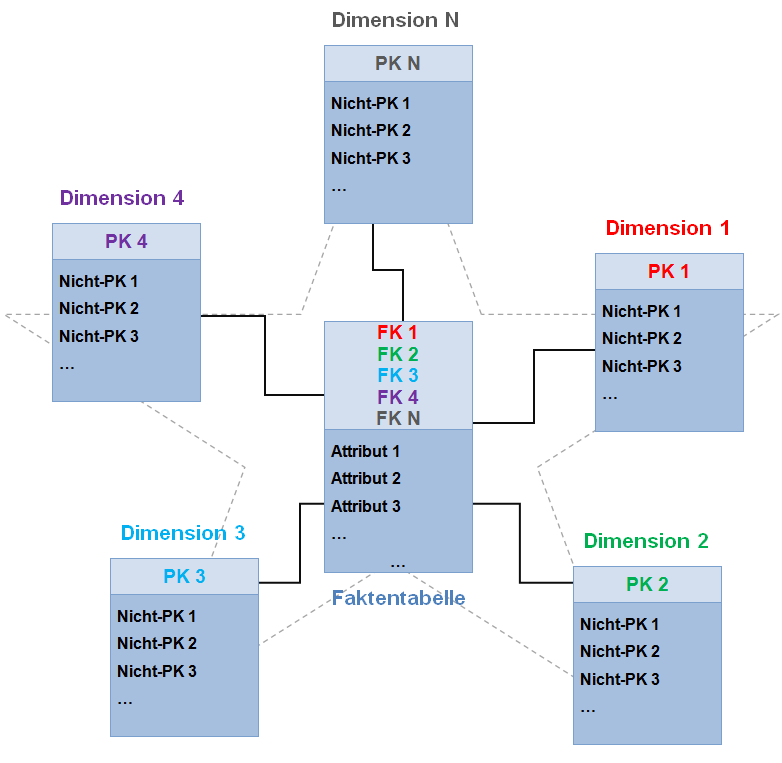
9. Use a denormalized (analytical) data schema
Your main application will likely be using a normalized database schema (eg. using '3rd normal form' or 'Backus-Naur form'). This ensures atomic nuggets of data are stored only once and thus no inconsistencies can arise.
Heavy use of joins can slow down analytical queries to a grind, however. Denormalizing your data into a single view or star schema helps.
10. Use a specialized analytical database
Alternatively, for your analytical queries, you can use a specialized analytical database that is further optimized to answer analytical queries with very low latencies. Tools that you can natively use in Luzmo include:
- Clickhouse
- Snowflake
- AWS Redshift