Query Logs
The Query Logs page in Luzmo is designed to enhance your ability to monitor, analyze, and optimize the performance of your data queries. This powerful tool offers a comprehensive overview of query activities within your Luzmo environment, providing the transparency and control needed to ensure efficient and reliable dashboards. Query logs can also be accessed via the Luzmo API, enabling you to build advanced custom workflows on top of them.
Benefits
- Transparency and control: gain visibility into your query performance, empowering you with the knowledge to make informed decisions and maintain optimal functionality of your dashboards.
- Troubleshooting and optimization: quickly identify failed queries and understand their causes for effective troubleshooting and optimization, ensuring your data retrieval processes are as efficient as possible.
- Enhanced user experience: by streamlining the monitoring and management of your queries, you directly improve the user dashboard experience, leading to more performant and user-friendly dashboards.
How to use it
Navigate to the Query Logs subpage on the Settings page to access an overview of all queries fired by your dashboards. The most recent queries will automatically be displayed on top of the table. Each row in the logs table represents a query made to one of your Connections and can be expanded to view detailed information.
Note that the logs table will contain different information based on your Luzmo organization role:
- Organization owners will see queries fired by all users in their organization
- Users with the designer role will only see queries triggered by themselves
The retention period of your query logs differs based on your subscription plan, with retention periods varying from 1 day to 30 days.
On the right side of the page a filters pane can be expanded, revealing extensive filtering options to quickly find specific queries that match certain conditions. The logs table is dynamically updated as filters are applied.
 A screenshot of the Query Logs page, showing filtering options.
What information is in the query logs
Each query log contains a timestamp of when the query was initiated, the connection source, dashboard, user and Duration. Expanding a query log provides additional information:
 A screenshot of a Query's expanded details
The Query ID, Chart ID and Trace ID are all Luzmo specific - these are useful for debugging failed queries and should be included in requests to support.
Generated SQL: Depending on the data source you will see the SQL query sent to your data source or the Luzmo query sent between the Luzmo query engine and source connector. As a future improvement the goal is to list the SQL query sent to the data source for all connectors.
Loading your Query Logs via the Luzmo API
Your query logs can also be accessed via the Luzmo API, allowing your developers and automation tools to integrate query log data into custom workflows or external applications, for example:
- automated alerting for failing queries
- automatic performance monitoring
- usage and access pattern analysis, cost management
The querylog endpoint by default returns 500 rows at once. You can combine the limit and offset properties in the API request to implement pagination, with a maximum of 1000 rows per batch.
Node.js code examples:
Loading all query logs of your organization, most recent first:
import Luzmo from '@luzmo/nodejs-sdk';

const client = new Luzmo({
    api_key: '< your API key >',
    api_token: '< your API token >'
  });

const result = await client.get('querylog', {
  limit: 50,
  offset: 0,
  order: [['started_at', 'desc']]
});
Loading only failed queries:
import Luzmo from '@luzmo/nodejs-sdk';

const client = new Luzmo({
  api_key: '< your API key >',
  api_token: '< your API token >'
});

const result = await client.get('querylog', {
  where: { success: false },
	limit: 50,
	offset: 0,
	order: [['started_at', 'desc']]
});
All attributes exposed in the Query Logs UI page will also be contained within the result object.
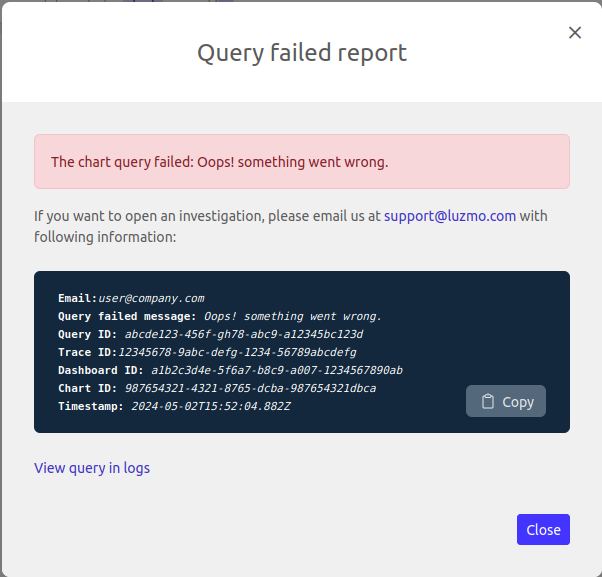
Query failed report
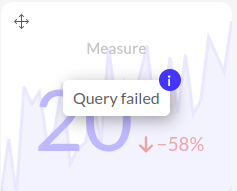
If a query fails while rendering a chart within the dashboard editor in the Luzmo platform, a query failed message will appear with a blue information circle on the top right corner.

Clicking on the message will open the query failed report which includes troubleshooting information.

If the error occurred after Luzmo was able to formulate a query, then there will be a link to "View query in logs" which you may click to open in another window the query logs filtered to this query.
This link will not be present if the query was not formulated, for example, if the user no longer has permission to view the dataset or the dataset has been deleted.