AI powered chart generation and editing
Create and edit charts effortlessly with Luzmo's AI-powered dashboarding tools. Generate meaningful charts from simple text prompts or suggested starting points, accelerating the entire process from idea to visualization.
Analyst
The Analyst page is now the primary page in Luzmo, sitting at the top of the menu and serving as the first thing you see after logging in. It allows you to ask questions about your data, generate charts and directly add those generated charts to any of your existing dashboards, extending the functionality that already lets you copy charts between dashboards.
How to create and edit charts in the dashboard editor
Navigate to the dashboard editor and use the "Add Item" button to open the dropdown menu. At the top, over the "Add empty item" section, you'll find the "Ask for a chart or insight" section.
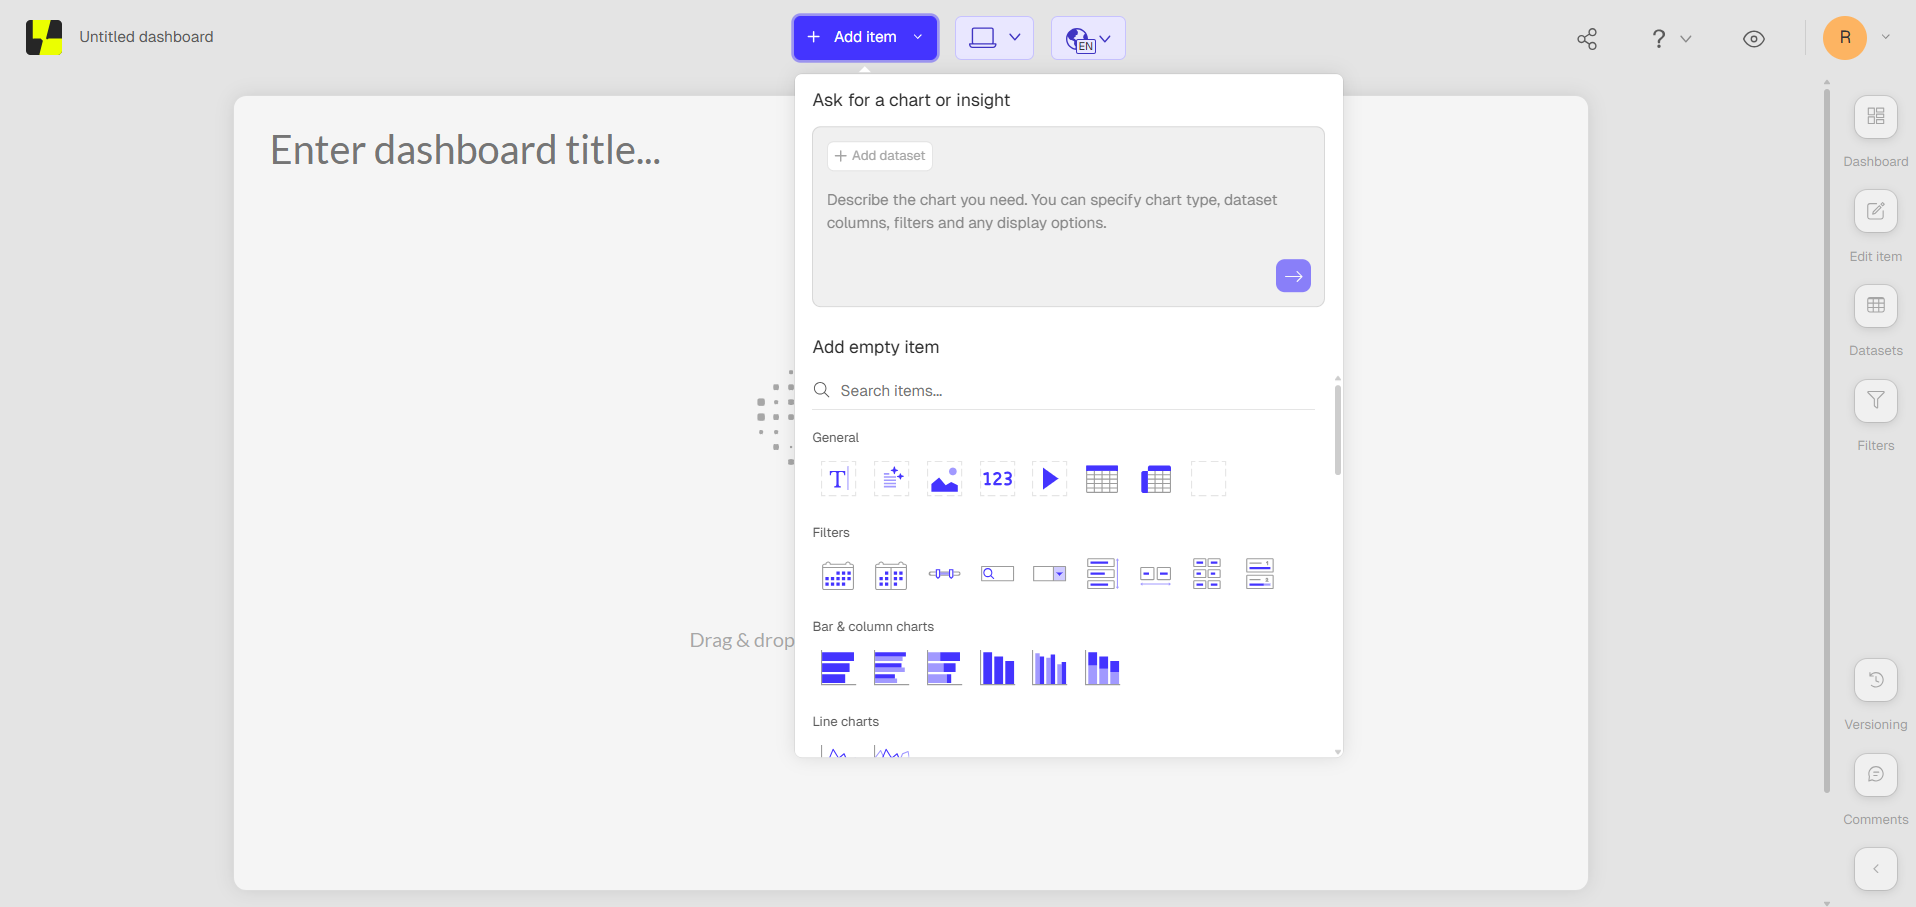 Adding the first chart via prompt.
This section features a dataset selector at the top, where you can select the dataset context that will be used for chart generation (note that multiple datasets can be used as context at the same time).
After you've selected the relevant datasets, you can use the prompt space in order to generate a chart visualizing specific metrics, for example: "Show me passengers by port". This adds a chart to the dashboard, with the Port column in the Y-axis slot and the Passengers column in the measure slot. If the generated chart does not satisfy all your requirements, you can use the "Prompt" tab in the "Edit item" section on the right side of the page to edit the chart using AI or access the "Settings" tab in order to manually modify the chart settings.
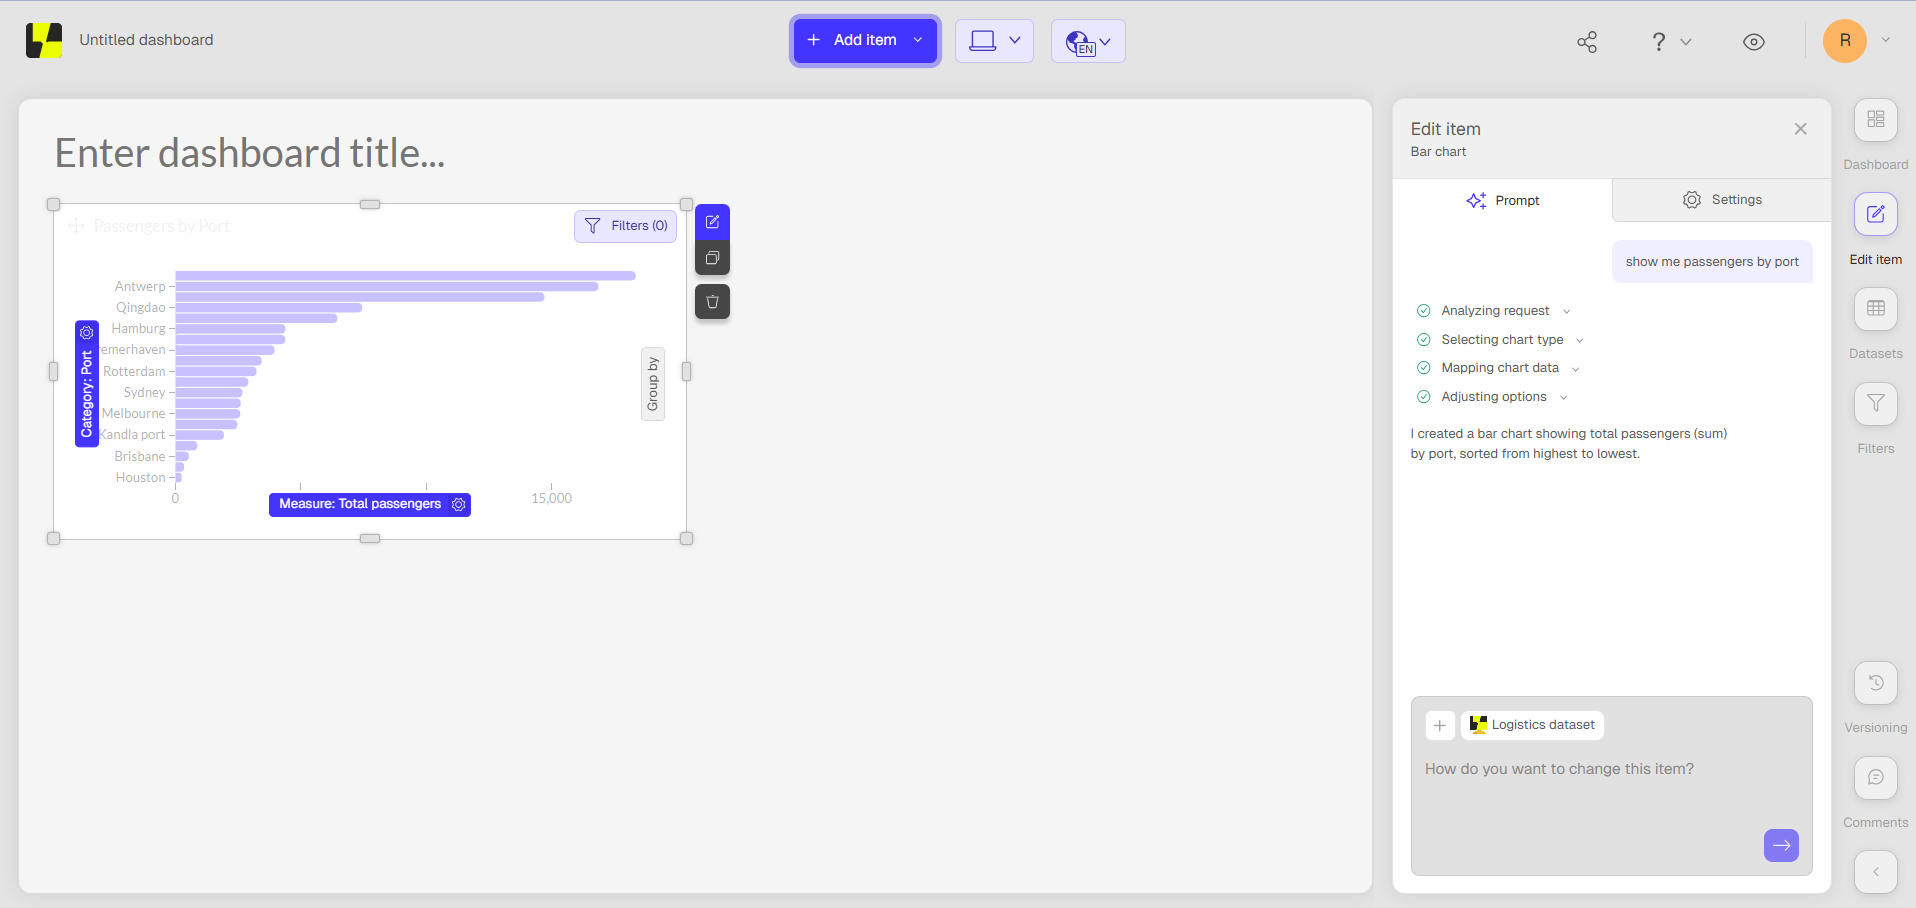 Editing a chart via prompt.
The AI editing was designed to allow you to build charts faster by describing what you need in plain language, and refine charts through conversation instead of manual configuration. The functionality allows you to:
- add multiple datasets as context
- tweak chart options
- add and edit chart filters
- add and edit chart data (slots)
- change the chart type through prompting
Please see the 1 minute video below for an example of this creation and editing process.
Usage in the Embedded Dashboard Editor
The Luzmo Embedded Dashboard Editor allows your end users to create and customize their own dashboards, next to viewing the ones you created. AI-powered chart creation assists users who may have less experience in dashboarding and visualizing metrics effectively.
By default, AI chart creation is enabled in the Embedded Dashboard Editor. To disable this feature, add !flag_ai_chart_generator to the feature_overrides array in your Embed token request. For more details on feature flags and their usage, refer to this article.
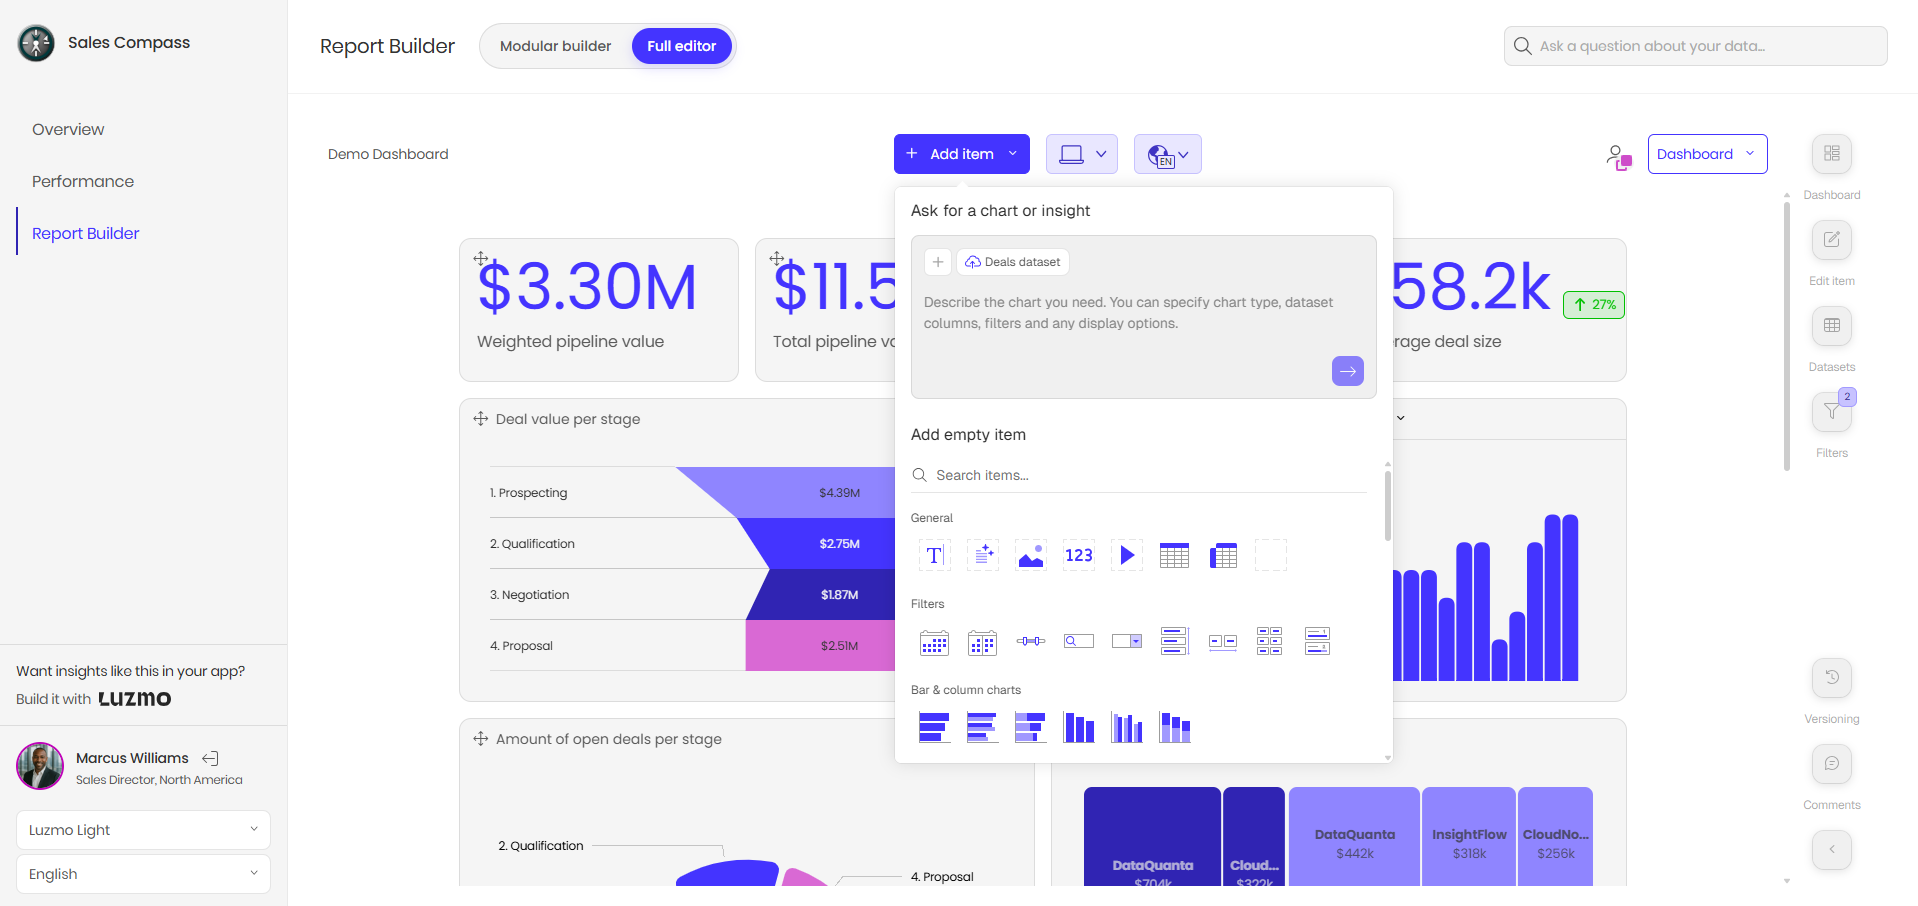 AI chart suggestions in the Embedded Dashboard Editor.
Tips and Tricks
- Better prompts lead to better results - you can reference specific columns with the "@" symbol in both the Analyst page and in the dashboard prompt boxes:
- Type @ in a prompt box to open a list of columns and formulas from your selected dataset(s)
- Typing after the @ filters the list to what you're typing
- Picked columns get inserted as structured chips in the prompt
- The prompt box is now fully keyboard accessible: use @ to trigger list, up/down arrows for list navigation, enter for confirmation
- Adding column descriptions to your datasets gives the AI more context about your data. Column descriptions can be added through the Dataset details page