What is possible with dashboards integrated with embed tokens?
Now that you have successfully integrated a Luzmo dashboard in your application using embed tokens, it is time to make sure all dashboards match your application and even add some great functionalities such as bi-directional communication between the dashboard and your application. Let's dive right into it!
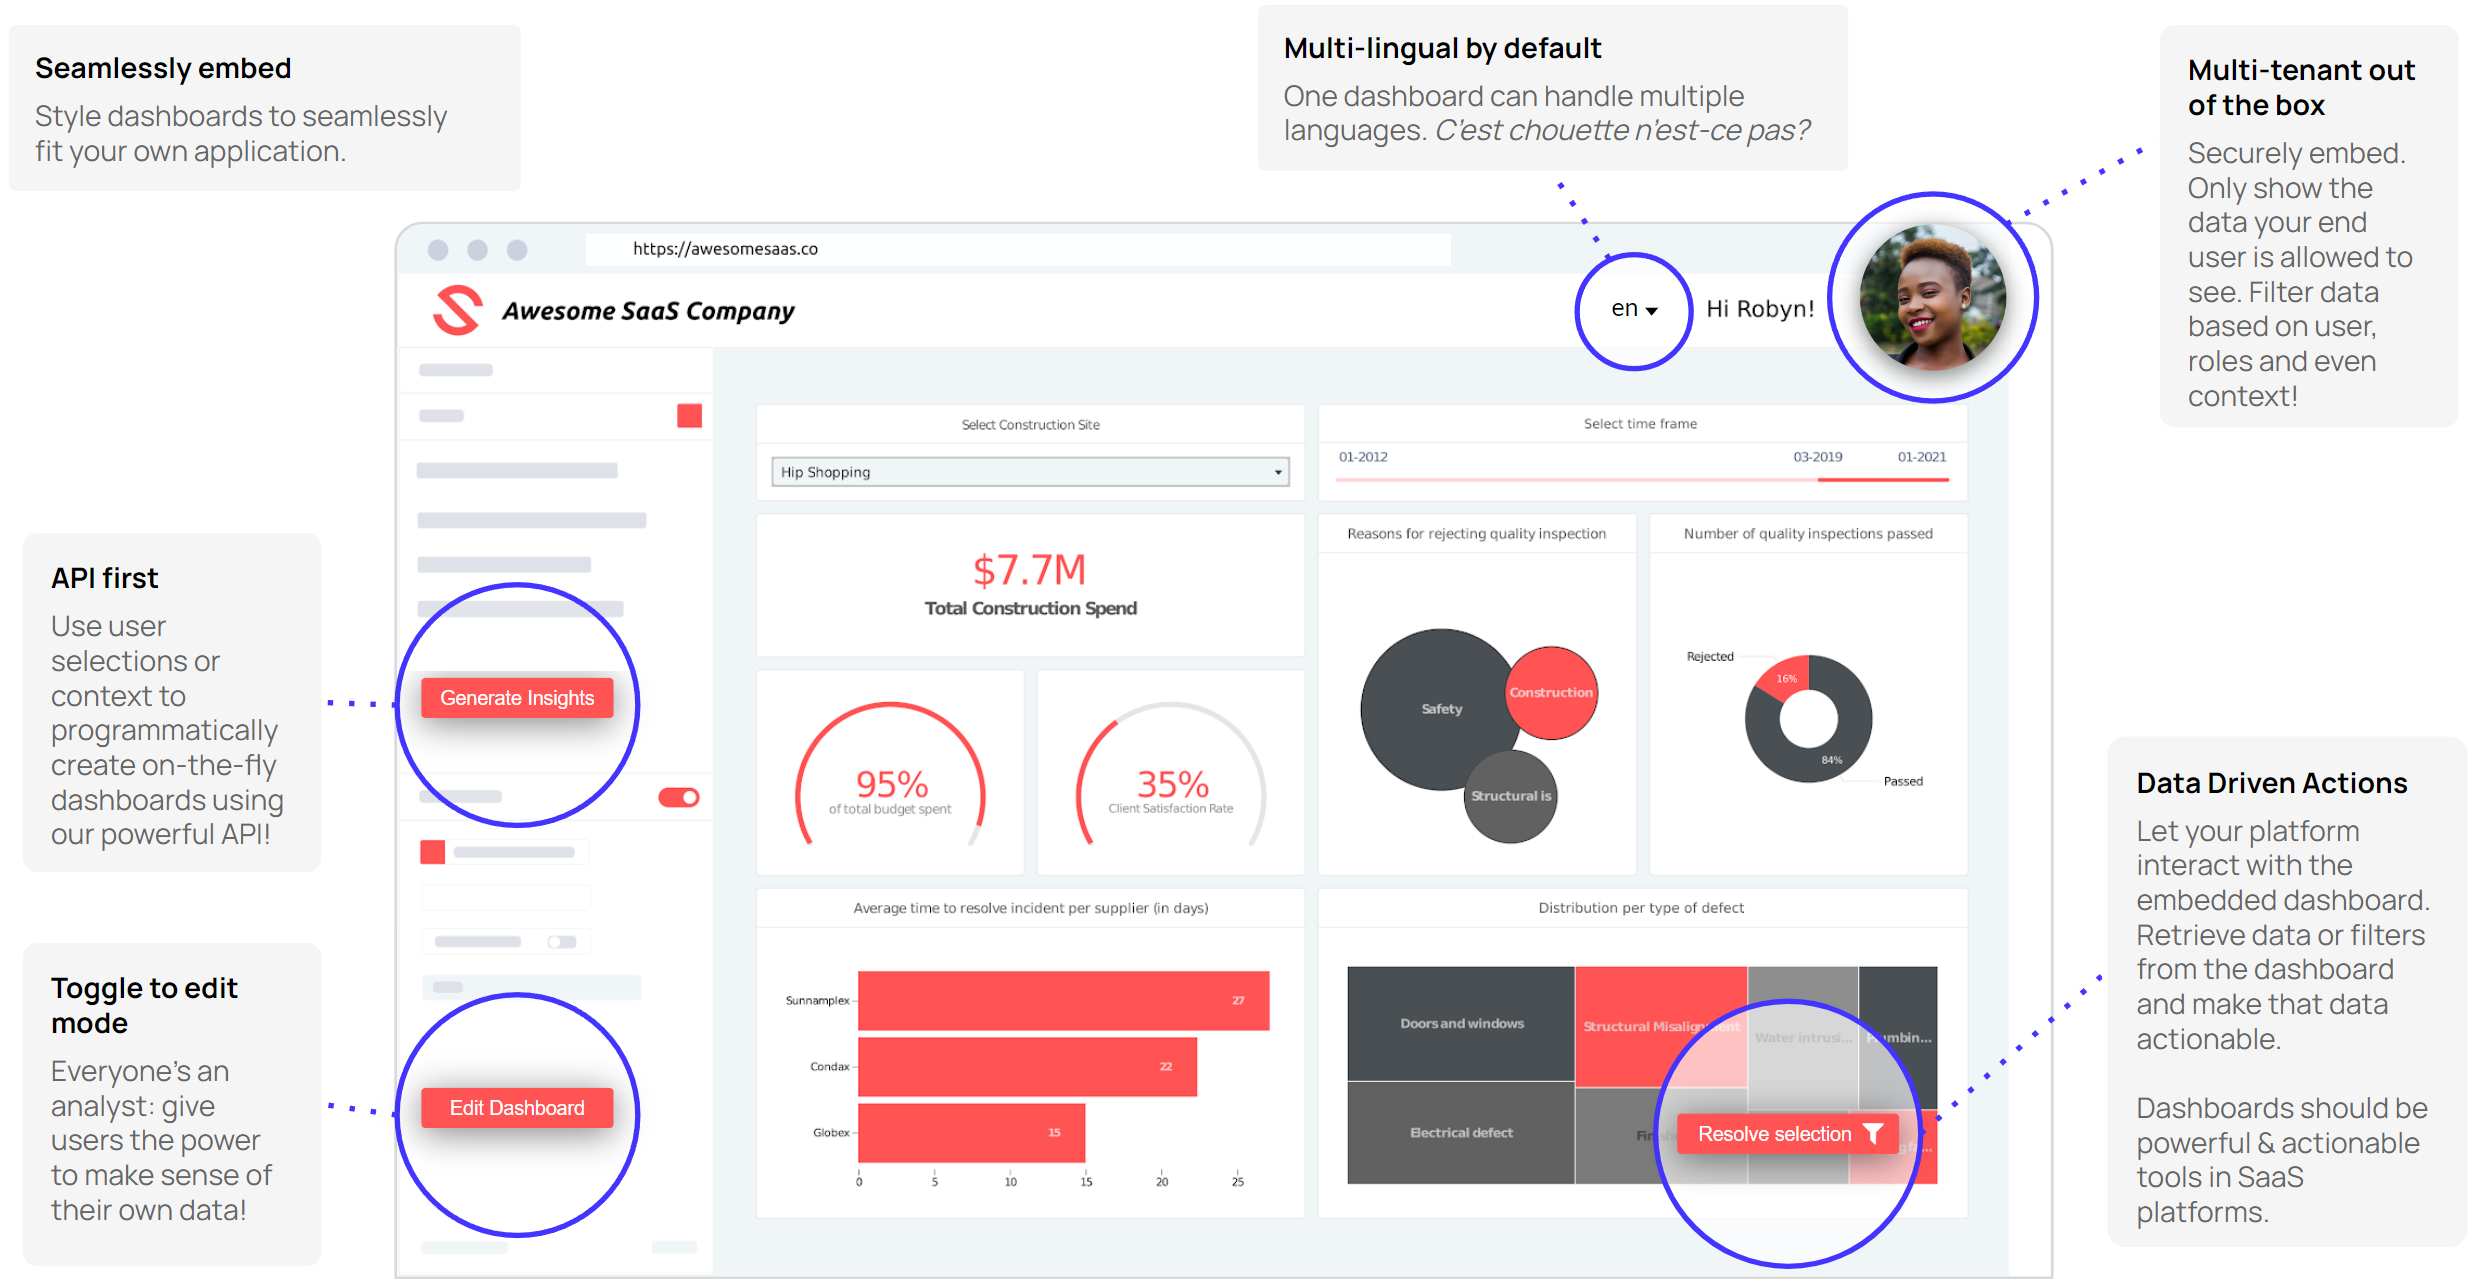
Increase dashboard engagement
- Enable your end users to create their own dashboards providing them with the Embedded Dashboard Editor. Also check out How to make the embedded dashboard editor a success in your application.
- Enabling your end users to be able to set Alerts on data shown in a dashboard is now possible when you've integrated your dashboards with an embed key and token. This is particularly useful if you'd like to enable your end users to be notified of certain thresholds being reached!
This Academy article explains what an Alert is, how you can set Alerts and how you can toggle the Alerting feature from within the dashboard editor.
Match your application's style
First of all, we recommend making the dashboards seamlessly fit in your application so your user-experienceis consistent throughout your whole application.
To ease your embedding experience, there is the possibility for you to remove the background color of a dashboard when embedding it. You can toggle this on/off under "Embedding options" at the dashboard level.
Check out these articles to learn how to create and save dashboard organization themes, but also how you can assert consistent colors to text values in your dataset and optimize your dashboard for different screen sizes.
You can also use theme overrides to override theme properties dynamically when requesting an authorization token for your dashboard(s). This will allow your users to have a personally styled dashboard, while you only need to maintain one template dashboard for all your users!
Next to that, you can add custom css injection by specifying the CSS code when requesting a temporary authorization token. This enables you to change all kind of things in the dashboard depending on the user looking at it.
You can ensure that the embedded dashboard (editor) and loader use your desired colors by specifying rgb colors (i.e. 'rgb(R, G, B)') for the loaderBackground, loaderFontColor, loaderSpinnerColor, loaderSpinnerBackground, mainColor and accentColor properties in your frontend! The mainColor en accentColor are only relevant in case of the Embedded Dashboard Editor. Changing the mainColor property will influence the color used for the "Add item", "Dashboard" and side menu buttons. Changing the accentColor property will influence the color used for the "Add dataset" button.
Localized dashboards
Make the dashboard fit with the language and currency of your user!
- You can easily translate dashboards and dataset values in Luzmo, which will give you the option to provide dashboards to your users in their chosen language. This article will show you the way! When embedding the dashboard in your frontend, you can specify the user's language and the dashboard will be loaded in that language if it has been added to the dashboard. You can find a chapter showing how you can specify the embedded dashboards language in the Dashboard Integration guide in our Developer documentation.
- In order to ensure your user sees their data with their specific currency symbol, you can dynamically specify the currency symbol the user should see when requesting an authorization token for your dashboard(s). More information on currency override can be found in this Academy article!
Bi-directional communication between your application and a dashboard
When dashboards are integrated in your application, they are actually able to interact with each other! Let's give a quick overview of which possibilities you have to add this interactivity:
You can easily make dashboard items point towards a custom url when clicked upon (e.g. going to a page within your application) by making use of their Go-to-URL functionality.
One of the most powerful feature is using Custom Events: when implemented in your dashboard and application, you can easily extend the interactivity and actionability of your insights by doing basically anything you want with the data that the user has selected in a widget. This is frequently used for implementing drill-throughs (i.e. going to a more detailed template dashboard that is filtered to the selected data in the first dashboard) which is neatly explained in this Academy article.
It's possible to decide how a filter or chart should initially be filtered, while giving your users the possibility to alter these filters: initialization filters allow you to dynamically initialize a filter or chart data point(s) selection in an embedded dashboard! This could for example be useful if you'd like to pre-filter dashboards based on the user in your application, by initializing e.g. a Slicer filter in the dashboard to specific values relevant to that user.
You can make use of getFilters to dynamically get the active filters in an embedded dashboard: in our Web Component and Vue.js Component this is implemented as a promise, but you can make use of the changedFilters event (in our Web Component) or changed-filters event (in our Vue.js Component) to listen to filter changes in an embedded dashboard. In our React, React Native and Angular libraries, getFilters is implemented as an observable! This could be useful when you have for example elements in your application that should be filtered to how the dashboard is being filtered (e.g. when your user selects something in a chart and the rest of the dashboard filters accordingly) or to load a dashboard with the same filtering active as when they last looked at it.
getData allows you to get the data of a single chart, e.g. in case you would like to do custom actions with the underlying data. This could be useful to e.g. target a specific selection of users based on which elements were selected in the dashboards, an example of this can be seen in our Sample Integration application which contains a button to get the data from the filtered table.
Now if you want to have elements of your application interacting with a dashboard (e.g. filter dashboard based on a selector in your application), you can! How would this work? When your selector changes, you have to generate a new authorization token with the corresponding filter values and then you can use the setAuthorization function to replace the authorization token, after which you will either use refreshData or reloadDashboard to make sure the chart(s) represent the changes to the authorization token.